What are Phred Scores?
Understanding Sequencing Quality in the Phred Score Format
What Are Quality Scores?
Quality score is the most formal name for describing the confidence assigned to some call made during next-gen sequencing (NGS). Fully understanding this topic, with all of its various conventions, compromises, and encoding schemes requires touching upon molecular biology, mathematics/statistics, and computer science (the three pillars of bioinformatics). The two most common places to see quality scores applied are raw sequence data and raw sequence alignment. In the raw sequence data, it will describe the confidence of each individual base call. In the alignment of raw sequence, quality scores will generally be available for the individual bases of the raw sequence as well as an additional quality score describing the alignment itself. In both cases, the quality score describes the confidence of the call being examined, whether the call is an individual nucleotide at a specific position in a read for raw sequencing, or an assigned position relative to a reference sequence from an alignment.
Whether an A, T, G, or C is being called at some position, the sequencer will always be making that call based upon some probability that the called nucleotide is at that position in the read, and not some other nucleotide. Likewise, when an aligner is calling the position of a read relative to a reference sequence, the aligner is making that call based upon the probability that the read really aligned to that position, and not somewhere else with a potentially similar sequence. If confidence is very low in a base call, the base will often be called as “N” or some other placeholder for an uncallable base and an alignment will show no assigned position or multiple potential positions (which will be indicated by the FLAG value that is described in our blog on the SAM/BAM file format). In addition to uncallable bases or alignments, some calls have low confidence where the sequencer or aligner may list a 10% or higher chance that the call was actually an error. While these calls can be used in the context of other reads that support or refute the call, it is important to know the confidences in each call when comparing them to reach a consensus.
Quality Scores, Q-scores, Phred Scores: What’s in a Name?
The names quality score, q score, and phred score are often used interchangeably, but are there any differences? As NGS studies almost always involve trying to read the same sequence several times (often in the order of dozens), and error rates for some methods can run as high as 1 in every 10 bases or even worse, it is vital to know how high or low the confidence is in a base or alignment call. This makes quality scores vitally important to many downstream bioinformatics applications in NGS. The name quality score is often abbreviated to q-score for the sake of brevity in less formal settings, as it can be referred to quite often in sequence analysis. These scores are also sometimes referred to as Phred scores, and while that descriptor is almost always applicable to quality scores, it actually describes a compression scheme or encoding that is very often, but (at least historically) not always applied to quality scores.
Phred, Sanger, and Solexa: Compressing 7-digit Values Down to 2 digits
At its very core, a quality score can be used to describe the chance that a call was correct (often referred to as confidence) or the chance that a call was incorrect (often referred to as the probability of error). These two values are inversely related and must sum to 1. Illumina reads will often assign a maximum per-base confidence of 99.99%, or 1/10,000 probability of error. Other platforms, such as PacBio reading in high-confidence mode, can assign even higher confidence to individual bases due to the PacBio high-confidence chemistry’s ability to read a given sequence several times to ensure correctness. Many aligners will assign a maximum confidence of 99.9999%, or 1/1,000,000 probability of error for a given alignment.
Because keeping such large numbers with sequencing data would require a significantly larger amount of storage than necessary, a compression or encoding scheme is used to scale the numbers. This causes some loss of fine detail at the very high-confidence end of the spectrum, but that is often acceptable, as the difference between a 1/10,000 chance of error and a 1/9900 chance of error is often considered trivial, while the difference between a 1/110 chance of error and a 1/10 chance of error is of great importance. The most common encoding scheme utilized is Phred, which is also often called Sanger, and its historic competitor is called Solexa. Both of these schemes achieve the same goal, and both of these schemes are almost interchangeable for high-confidence values. At lower-confidence values, they begin to diverge significantly. The equations describing these schemes are below, with p denoting the probability of error and Q denoting the encoded quality score.
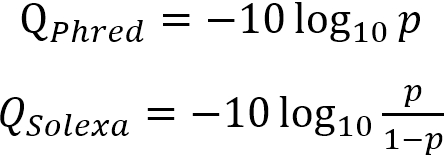
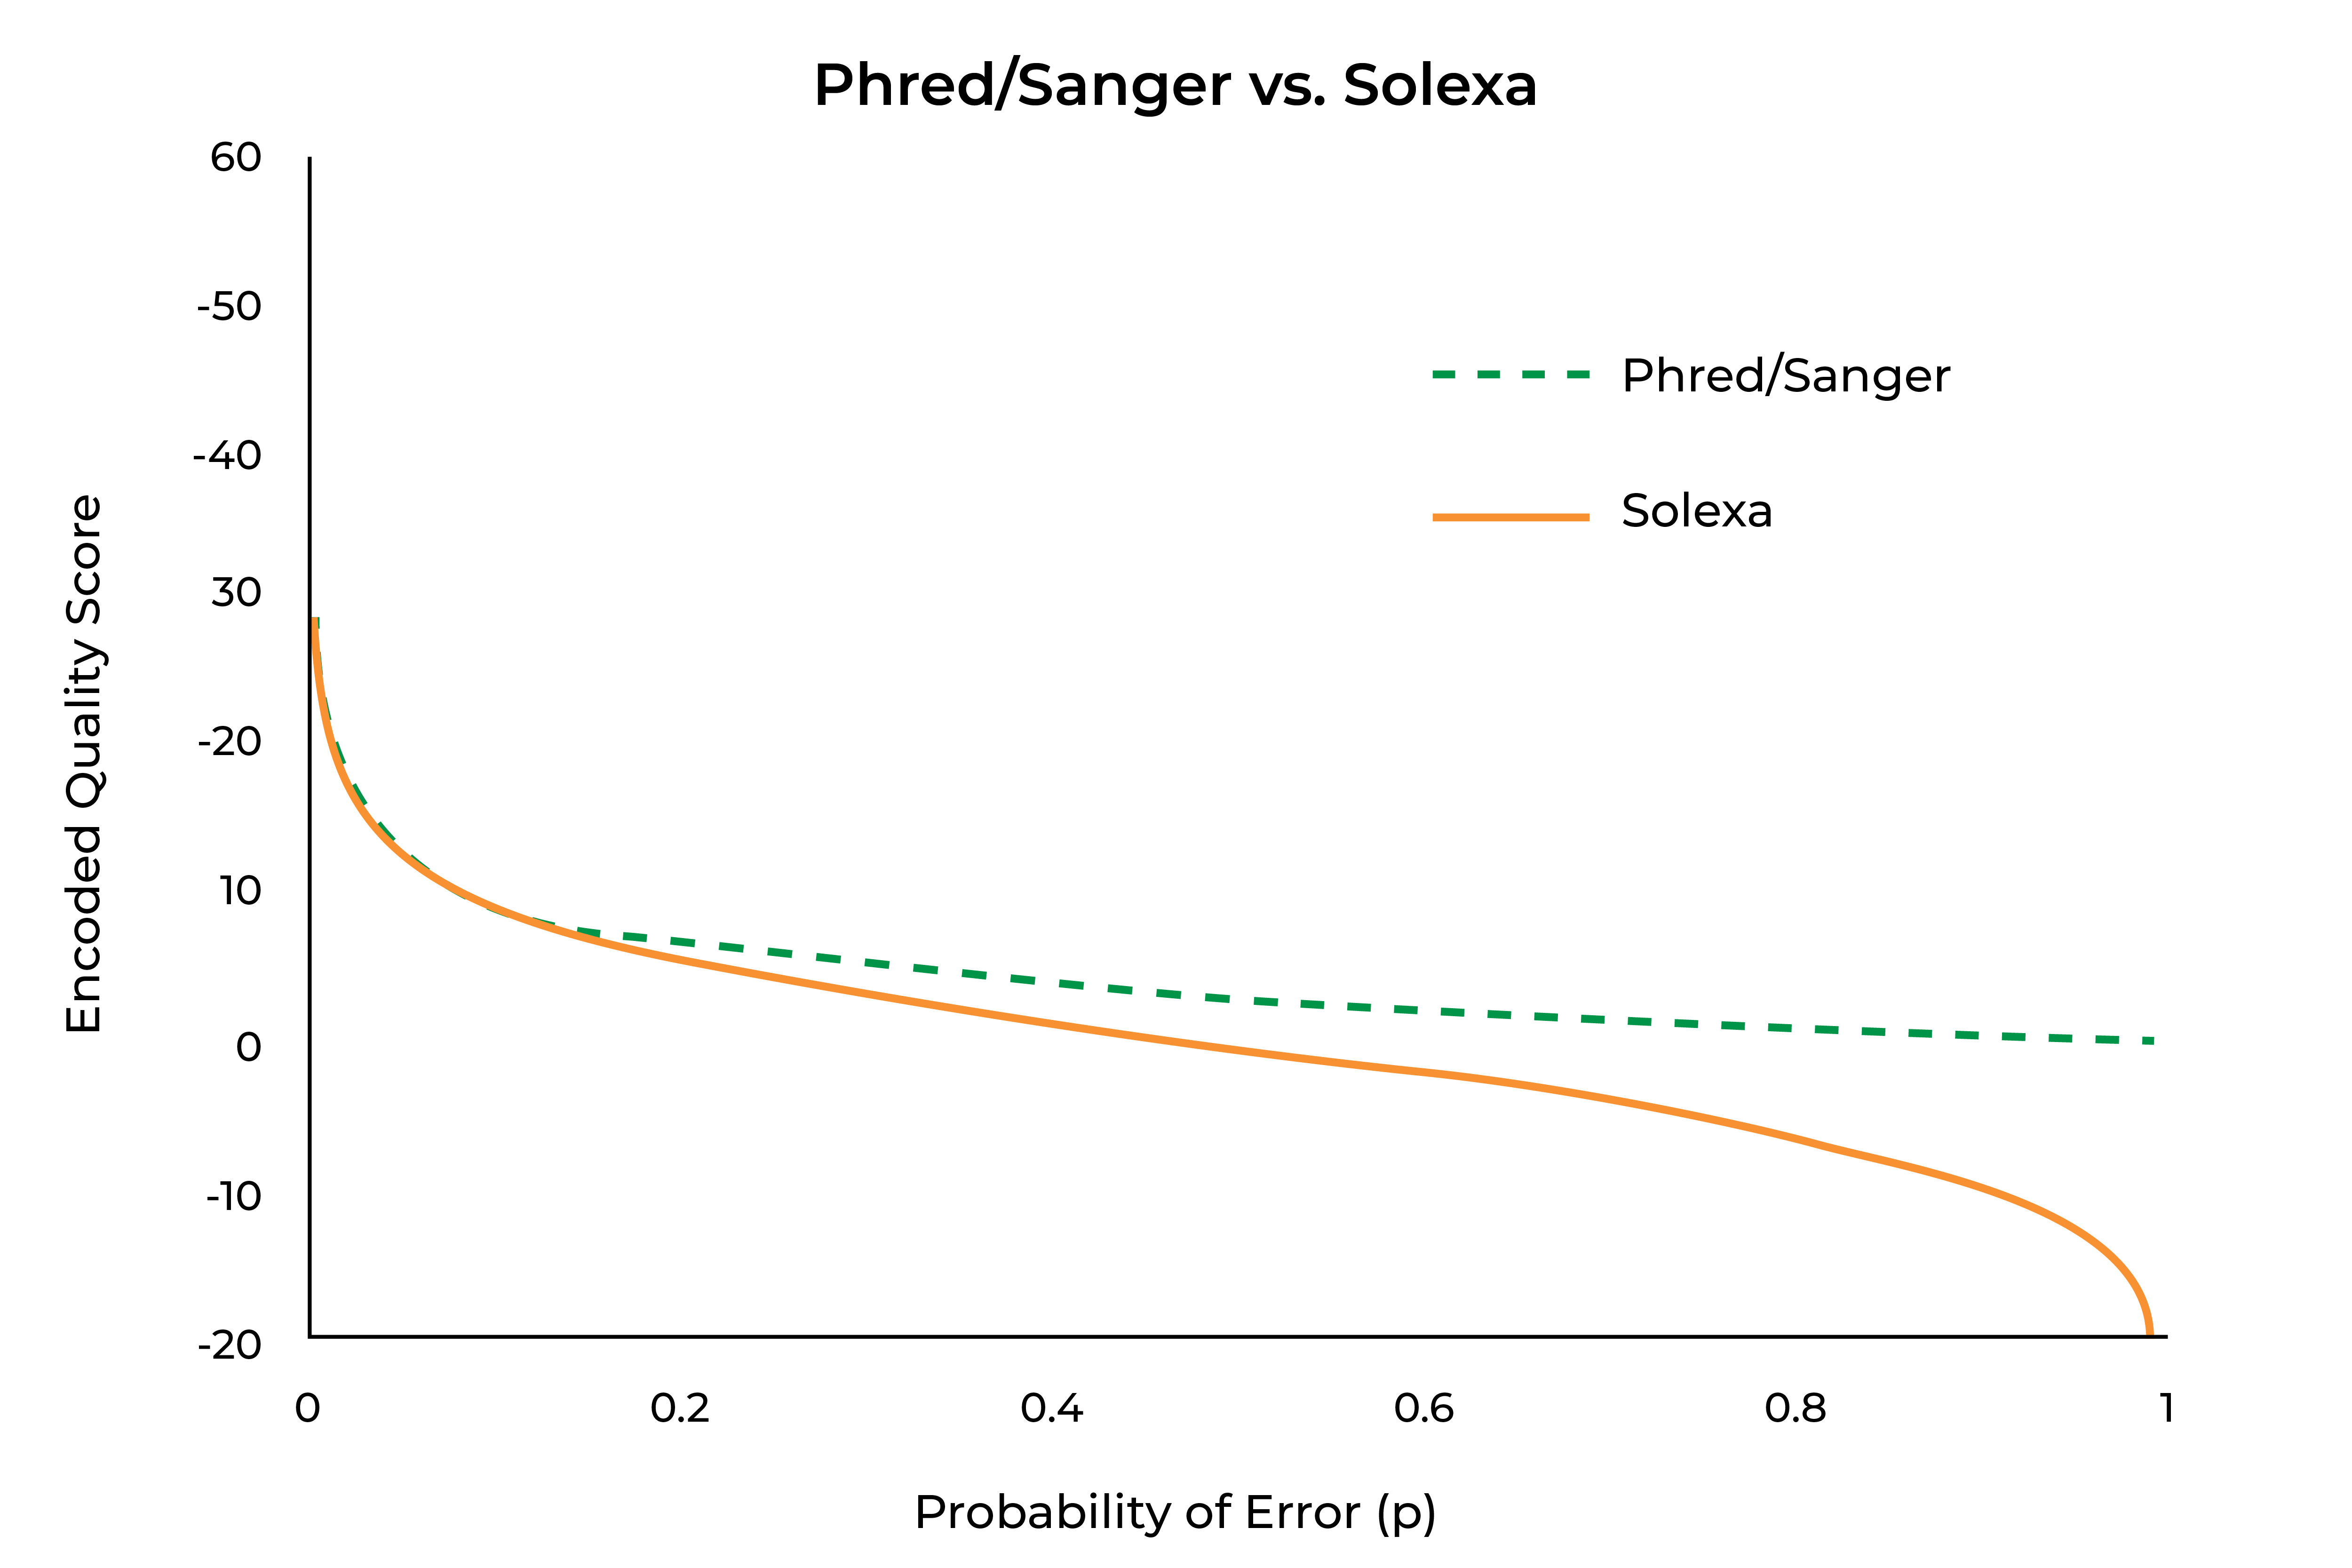
Looking at these equations, one can see that as p becomes smaller, the denominator portion of the Solexa encoding approaches 1, making it approach equivalence with the Phred/Sanger encoding scheme. At larger values of p, that denominator approaches 0, causing it to become more divergent from the Phred/Sanger encoding, and potentially causing it to generate negative numbers (something that is not possible for Phred/Sanger encoding). This does give Solexa encoding the useful property of encoding to 0 where p=0.5 (or equal chances of a correct and erroneous call), as can be seen in the graph below:
Estimation of Confidence from Phred-Encoded Quality Scores
Currently, Phred-encoded quality scores are the norm, but Solexa-encoded data may be found if older sequencing studies are being revisited, and users should be aware of this. As can be seen in above, Phred-encoded quality scores have a much simpler equation, although neither equation is one that most individuals would want to calculate in their head. Fortunately, there is a relatively simple “rule of thumb” that applies to encoded quality scores for values 10 and above. The two schemes differ in the meaning of a 0, with Phred score of 0 indicating absolutely no confidence in the call and a Solexa score of 0 indicating equal chances of a correct and incorrect call. As seen in the above graph, the scores are nearly identical at values of 10 and above, with the “rule of thumb” being exact for Phred-encoded data and very nearly exact for Solexa-encoded data. In practice, a Phred score of 0 will rarely or never be seen, as that would indicate absolute certainty of an incorrect call. Often Phred scores will have a minimal value of 2, at which point an “N” will be inserted in the sequence, to indicate that no base call was possible or the aligner will flag the read as unalignable.
|
Phred Quality Score (Q) |
Probability That a Base Call Was Incorrect |
How Accurate the Base Call Was (%) |
|
10 |
1 in 10 |
90% |
|
20 |
1 in 100 |
99% |
|
30 |
1 in 1000 |
99.90% |
|
40 |
1 in 10,000 |
99.99% |
For example, given a Phred-encoded quality score of 20 (also sometimes abbreviated to Q20), one can quickly figure out that the confidence in the corresponding call is 99%, or 1/100 chance of error. Given a quality score of 32, one can estimate that it is somewhere between 99.9% and 99.99% confidence, or 1/1000 and 1/10,000 chance of error, with the exact value probably falling somewhere closer to 1/1000 chance of error.
From Quality Score to Quality String
What is a String?
In computer science, a string is a specific type of variable that is composed of characters. Characters can be divided into printing (characters that appear on the screen) and non-printing (characters that don’t), with the A’s, T’s, G’s and C’s (and a few N’s, if the sequencer was having a bad day) creating a string of printing characters. In addition to this, the DNA sequence, along with A, T, G, and C, is going to have a character called newline at the end of the sequence. This newline character is a non-printing character that signifies the end of the line and tells computer programs that they have reached the end of the sequence and there is something different after. This non-printing newline character does not show up on the screen (although certain programs will provide methods visualize them), but instead causes the next printing character to be displayed on a new line.
Because each base in DNA is encoded with a single letter, if there was a way to further encode quality scores down to a single character, instead of a two-digit number as above, a string of values representing quality scores could be generated that would be the same length as the DNA sequence, with each character position in the DNA sequence corresponding to the same character position in the string of encoded quality scores. The quality string does just this.
ASCII Character Encoding: 2-digit Quality Scores Compressed to a Single Character
Fortunately, unlike the many examples of competing encoding schemes presented in this series (QSEQ vs. FASTQ, Phred vs. Solexa, etc.), American Standard Code for Information Interchange (abbreviated ASCII and almost universally pronounced ask-EE) has been the standard for encoding characters to numbers since well before modern DNA sequencing techniques were developed. This encoding scheme was initially developed for a widely-used machine known as the teletype where a user could type a message while connected to a phone line, and the message would be printed elsewhere (this system, abbreviated TTY, is still in use today as , but mostly to provide phone system accessibility to the hearing-impaired). Because the original computer keyboards were TTY devices connected to early mainframes, this standard has persisted in computing for decades and was an easy choice for encoding a one- or two-digit value to a single character.
A table of ASCII values can be seen below, with the non-printing characters having a dark grey background and the printing characters having a white background. The white space (generated every time the spacebar is pressed) is in light grey, as it is considered a printing character for some purposes and a non-printing character for others (as it does print, but what it prints is fully invisible).
|
Value |
Character |
Value |
Character |
Value |
Character |
Value |
Character |
Value |
Character |
Value |
Character |
|
0 |
Null |
22 |
Synchronous Idle |
44 |
, |
66 |
B |
88 |
X |
110 |
n |
|
1 |
Start of Heading |
23 |
End of Transmission Block |
45 |
- |
67 |
C |
89 |
Y |
111 |
o |
|
2 |
Start of Text |
24 |
Cancel |
46 |
. |
68 |
D |
90 |
Z |
112 |
p |
|
3 |
End of Text |
25 |
End of Medium |
47 |
/ |
69 |
E |
91 |
[ |
113 |
q |
|
4 |
End of Transmission |
26 |
Substitute |
48 |
0 |
70 |
F |
92 |
\ |
114 |
r |
|
5 |
Enquiry |
27 |
Escape |
49 |
1 |
71 |
G |
93 |
] |
115 |
s |
|
6 |
Acknowledgement |
28 |
File Separator |
50 |
2 |
72 |
H |
94 |
^ |
116 |
t |
|
7 |
Bell (Causes an alert sound) |
29 |
Group Separator |
51 |
3 |
73 |
I |
95 |
_ |
117 |
u |
|
8 |
Backspace |
30 |
Record Separator |
52 |
4 |
74 |
J |
96 |
@ |
118 |
v |
|
9 |
Horizontal Tab |
31 |
Unit Separator |
53 |
5 |
75 |
K |
97 |
a |
119 |
w |
|
10 |
Line Feed |
32 |
space |
54 |
6 |
76 |
L |
98 |
b |
120 |
x |
|
11 |
Vertical Tab |
33 |
! |
55 |
7 |
77 |
M |
99 |
c |
121 |
y |
|
12 |
Form Feed |
34 |
" |
56 |
8 |
78 |
N |
100 |
d |
122 |
z |
|
13 |
Carriage Return |
35 |
# |
57 |
9 |
79 |
O |
101 |
e |
123 |
{ |
|
14 |
Shift Out |
36 |
$ |
58 |
: |
80 |
P |
102 |
f |
124 |
| |
|
15 |
Shift In |
37 |
% |
59 |
; |
81 |
Q |
103 |
g |
125 |
} |
|
16 |
Data Link Escape |
38 |
& |
60 |
< |
82 |
R |
104 |
h |
126 |
~ |
|
17 |
Device Control 1 (often XON) |
39 |
' |
61 |
= |
83 |
S |
105 |
i |
127 |
Delete |
|
18 |
Device Control 2 |
40 |
( |
62 |
> |
84 |
T |
106 |
j |
||
|
19 |
Device Control 3 (often XOFF) |
41 |
) |
63 |
? |
85 |
U |
107 |
k |
||
|
20 |
Device Control 4 |
42 |
* |
64 |
@ |
86 |
V |
108 |
l |
||
|
21 |
Negative Acknowledgement |
43 |
+ |
65 |
A |
87 |
W |
109 |
m |
To encode a quality score as a single character, first it needs to be compressed, or encoded, down to a two-digit number by Phred (or, in the past Solexa) encoding. For a call with a confidence of 99.9%, or 1/1000 chance of error, we would get a Phred score of 30. Looking at the ASCII chart above, a 30 is the backspace character, which does not print (and worse yet, may delete whatever is before it). To get around this, the character encoding scheme adds in a base value. The most commonly used base value is 33, corresponding to the first visible printing character: the exclamation point. A less commonly used standard, but one that was often employed in combination with Solexa and occasionally with Phred encoding is 64. This value was chosen because scoring schemes will often not have 0 as a possible quality score, meaning that the “@” symbol (ASCII character 64) would not be a potential character for quality encoding and could be left to exclusively signify the beginning of a FASTQ sequence ID line. The common method of denoting the encoding scheme is to first list the scheme for scaling numbers (Phred or Solexa) and then the signed base value. The most common scheme, and the standard at the time of this writing, is Phred +33.
The Quality String
Quality strings are a sequence of printing characters (a string) with each individual character encoding for a two-digit, encoded quality score where each character in the string corresponds to the quality score for the base call at the same position in the DNA read. In a FASTQ file, the sequence and quality string lines are separated by a line starting with a “+” symbol and often containing nothing else (although occasionally notes may be added to this line) as seen below.
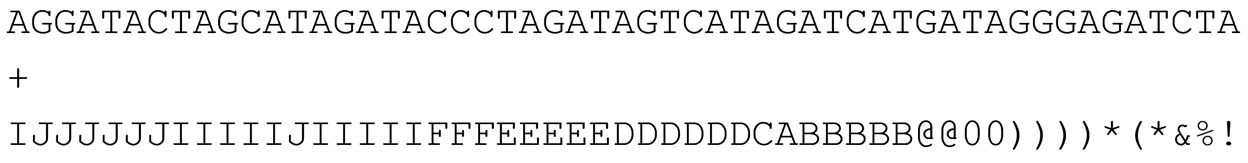
In FASTQ format example above files, the first base “A” from left to right of the read is associated with the “I” in the quality string below it. Next, base “T” is associated with quality string character “J”, and so forth. In fact, one reason for the popularity of the FASTQ format over its main competitor, QSEQ, is that bases and their corresponding quality score characters line up vertically!
Converting a Quality String to an Estimated Confidence
To estimate the probability that the first base in this read really was an “A,” we go through the following transformations:
Quality string character > Two-digit integer > Base Value Adjustment > Phred Quality Score > Confidence
The ASCII value for an “I” is 73. The base value for this encoding is 33, so that gets subtracted off for a Phred score of 40. Using the “rule of thumb” in the chart above, no estimation is needed, as 40 is one of our exact values and indicates a 1/10,000 chance of error or 99.99% confidence that the first base in that read really is an “A.”

Basic Usages of Quality Strings
Quality strings can be used in many ways, but one of the most common and easy to understand is read trimming and/or filtering. A common technique is to examine a certain number of bases at a time and compute the average quality score for this “window” within the read. If the quality is above the threshold, slide the window over by one position and examine the new values. This algorithm is called the sliding window approach and the goal is to find a region where the average quality dips below some threshold and trim off the read at that point due to low quality. If a read reaches this threshold too early (i.e. its quality degraded quickly, suggesting a poor read overall), the entire read can be filtered out.
Average vs. Expected Error
An alternative method of interpreting quality scores is to calculate the sum of error probabilities in the read up to a given point. This value is called the expected error, as it tells the user how many errors they can expect to find in the read up to that point. This approach is often considered superior and is in use by many newer bioinformatics packages, including DADA2 by Benjamin Callahan and FIGARO, which supports DADA2 and was developed here at Zymo Research. To see how these methods differ, see the chart below of a hypothetical pair of reads, both of length 13 and average Phred score of 30:
|
Position |
1 |
2 |
3 |
4 |
5 |
6 |
7 |
8 |
9 |
10 |
11 |
12 |
13 |
|
|
|
Phred |
30 |
30 |
30 |
30 |
30 |
30 |
30 |
30 |
30 |
30 |
30 |
30 |
30 |
30 |
Average |
|
EE |
0.0010 |
0.0010 |
0.0010 |
0.0010 |
0.0010 |
0.0010 |
0.0010 |
0.0010 |
0.0010 |
0.0010 |
0.0010 |
0.0010 |
0.0010 |
0.0130 |
Sum |
|
|
|
|
|
|
|
|
|
|
|
|
|
|
|
|
|
|
Position |
1 |
2 |
3 |
4 |
5 |
6 |
7 |
8 |
9 |
10 |
11 |
12 |
13 |
|
|
|
Phred |
40 |
4 |
40 |
40 |
10 |
38 |
3 |
15 |
40 |
40 |
40 |
40 |
40 |
30 |
Average |
|
EE |
0.0001 |
0.3981 |
0.0001 |
0.0001 |
0.1000 |
0.0002 |
0.5012 |
0.0316 |
0.0001 |
0.0001 |
0.0001 |
0.0001 |
0.0001 |
1.0319 |
Sum |
While both reads have the same length and same average Phred score, the top read has a 0.0130, or slightly more than a 1/100, expected errors, meaning that it is unlikely that read contains any incorrect base calls. The bottom read has an expected error value of 1.0319, meaning that it is quite likely that at least one base call in the lower read (out of only 13) is incorrect. While both reads have the same length and average quality score, the actual utility of 13 base read is significantly higher with little or no expected error compared to a similar read with an error expected somewhere within it.