
Dig Into Extraction Bias
with ZymoBIOMICS® Spike-in Controls I & II
Request Free Sample
ZymoBIOMICS® Spike-in Control I (High Microbial Load) and Spike-in Control II (Low Microbial Load) are in situ positive controls for DNA-sequencing-based microbiome measurements. Spike-in Control I consists of equal cell numbers of Imtechella halotolerans (Gram-negative) and Allobacillus halotolerans (Gram-positive), while Spike-in Control II includes Truepera radiovictrix, Imtechella halotolerans, and Allobacillus halotolerans in log abundance distribution. Each chosen bacteria represents a different challenge in NGS-based analysis. Moreover, with accurately quantified cell numbers, these controls enable absolute cell number quantification in applications such as pathogen load detection.
ZymoBIOMICS® Spike-in Controls Provide:
Reliable Detection in Samples with Varying Biomass
ZymoBIOMICS® Spike-In Control I

ZymoBIOMICS® Spike-In Control II


Figure 1. ZymoBIOMICS® Spike-in Control Detection Assays were used to assess spike-in recovery across samples having high (fecal) to low (male urine) biomass. Samples were collected in DNA/RNA Shield or Urine Conditioning Buffer (D3061) and extracted using the ZymoBIOMICS® DNA Miniprep Kit (D4300). Bacterial biomass of each sample was determined by detecting total 16S rDNA using the Femto Bacterial DNA Kit (E2006). Real-time PCR was performed on the Bio-Rad CFX96 Touch System.
Identify Microbial Lysis Bias
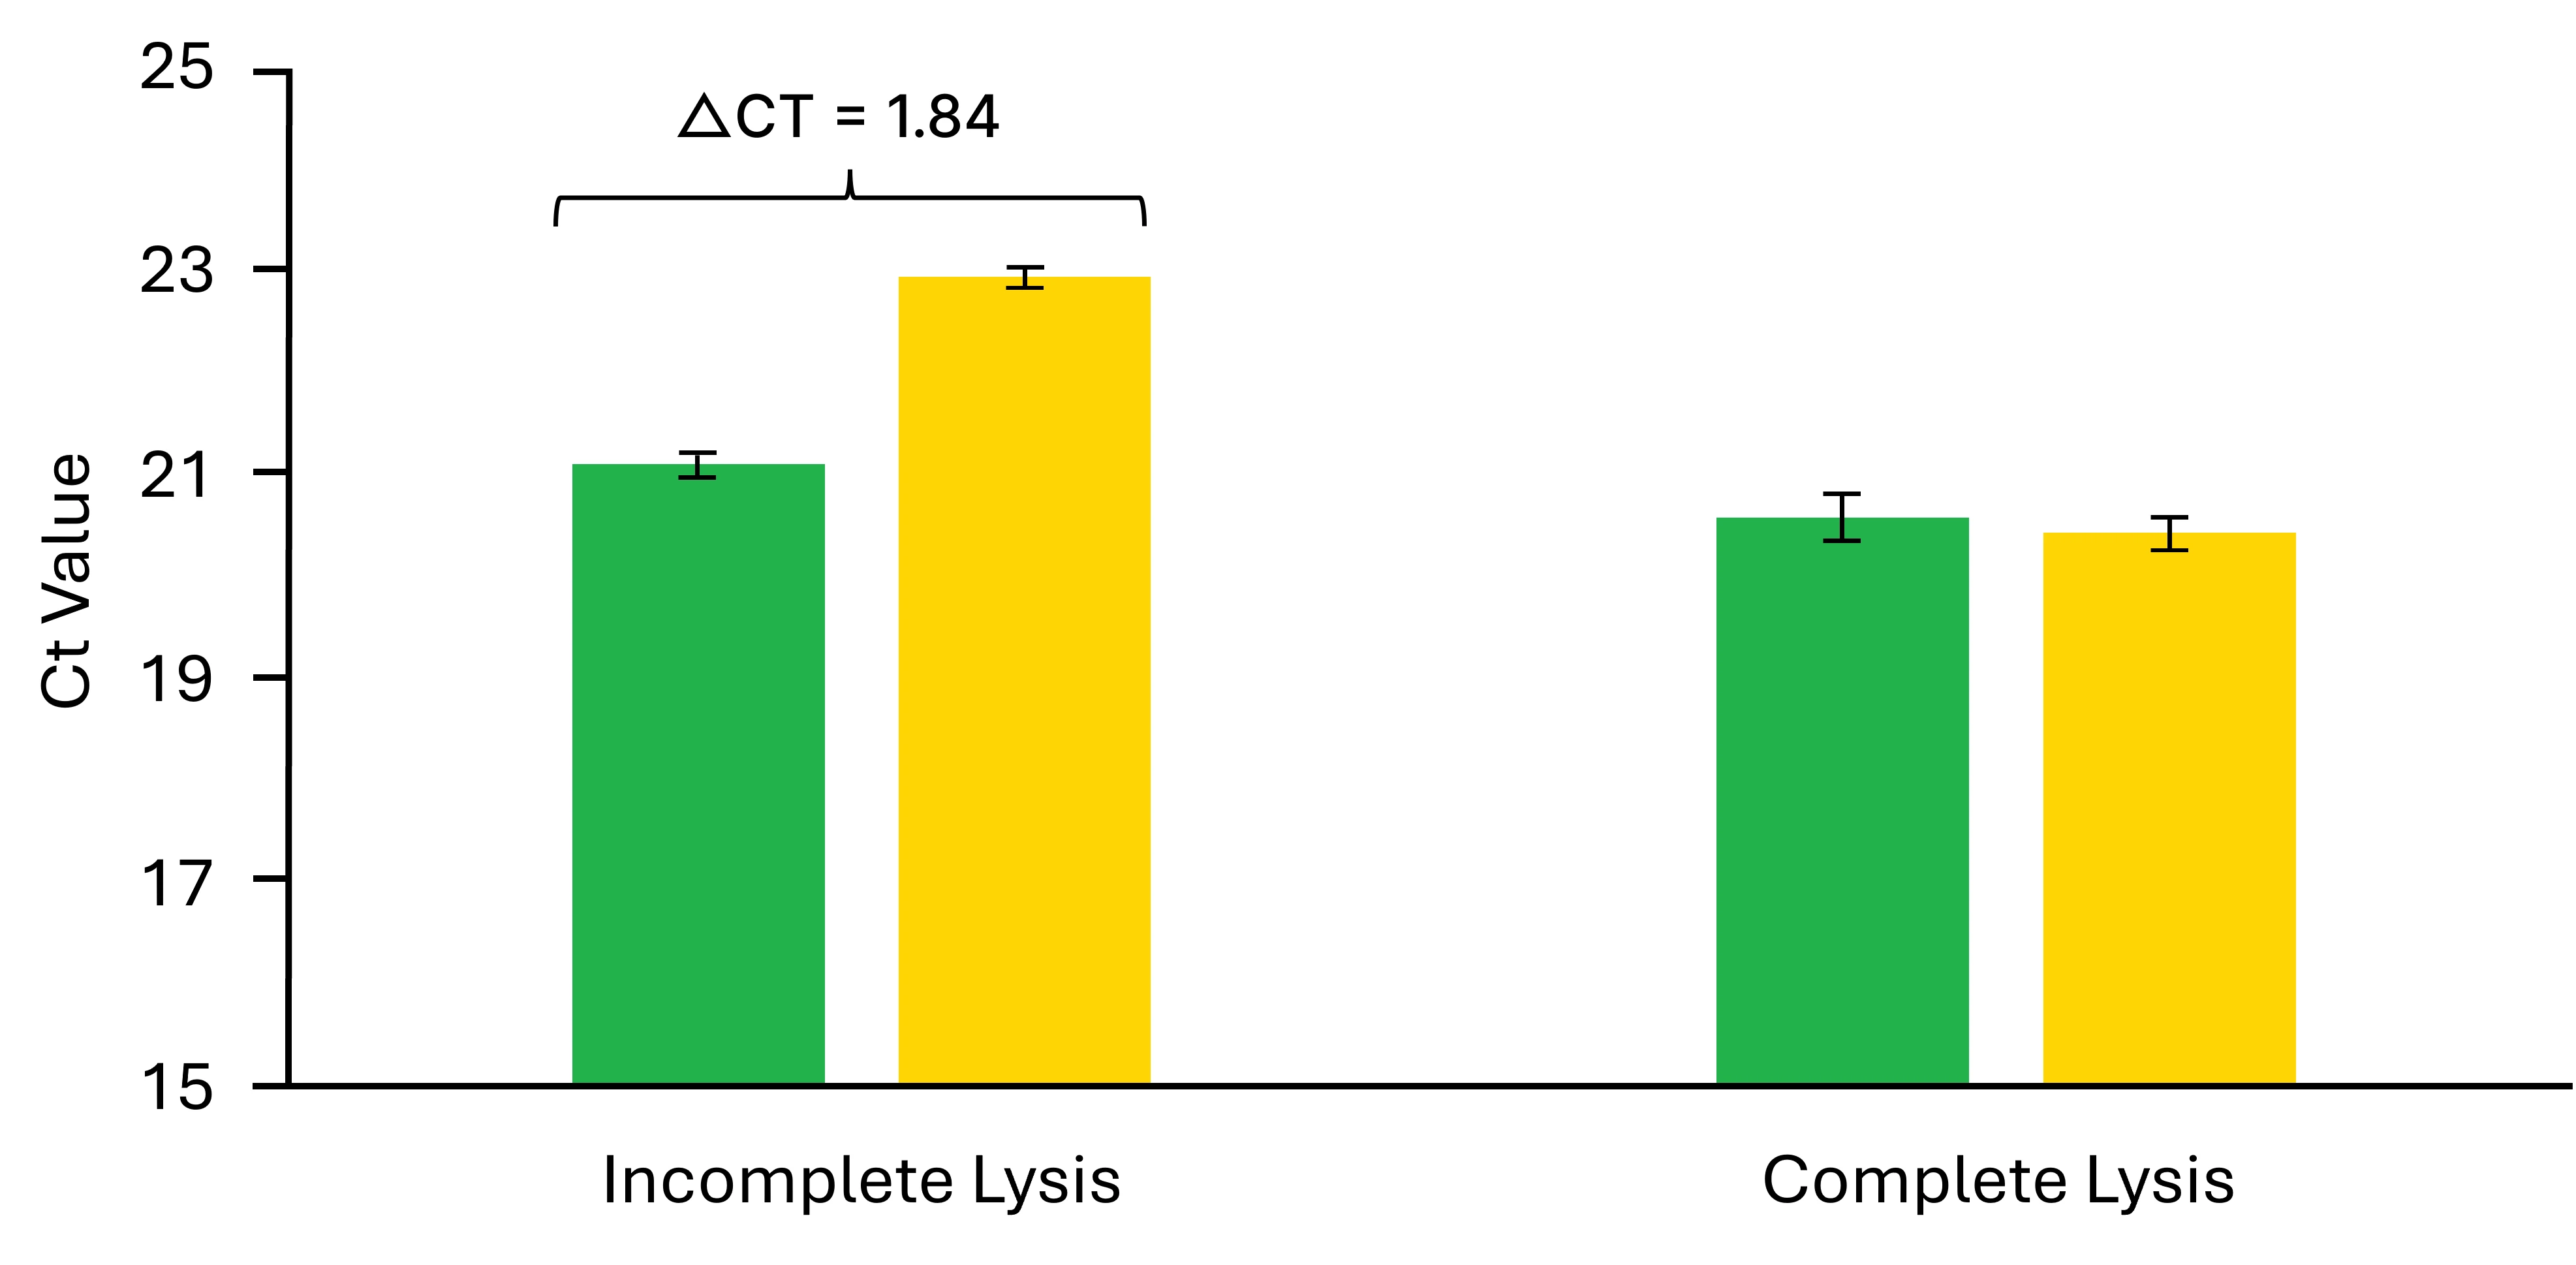

Figure 2. The ZymoBIOMICS® Spike-in Control I Detection Assay was used to assess lysis bias between two different extraction conditions. Lysis bias was determined by comparing the amplification of Allobacillus halolerans and Imtechella halotolerans. Incomplete or biased lysis was observed in one extraction condition, where the tough-to-lyse microbe, Allabacillus halotolerans, amplified over 1.8 cycles later than the easy-to-lyse microbe. Real-time PCR was performed on the Bio-Rad CFX96 Touch System.
Determine Absolute Abundance


Figure 3. The relative abundances of the three spike-in strains can be used to draw a standard curve for quantification of other microbial organisms. The percent relative abundance generated via shotgun metagenomic analysis (left) is plotted against the corresponding composition data from Table 1 of the protocol (right). The resulting linear equation can then be used to calculate genomic DNA quantity for any identified taxa, which in turn can be used to estimate total genomic copy number with the following equation: (Genomic DNA Quantity (ng) × 9.265 x 10e11 ng/bp)/(Genome Size (bp))
Technical Specifications
ZymoBIOMICS® Spike-in Control I (D6320)
-
Recommended Sample Types
High Biomass (e.g., Fecal, Soil, Wastewater) -
Included Strains
Imtechella halotolerans - 2.0 x 10⁷ cellsAllobacillus halotolerans - 2.0 x 10⁷ cells
ZymoBIOMICS® Spike-in Control II (D6321)
-
Recommended Sample Types
Low Biomass (e.g., Urine; Nasal, Oral, Vaginal Swabs) -
Included Strains
Truepera radiovictrix - 1.0 x 10⁵ cellsImtechella halotolerans - 1.0 x 10⁴ cellsAllobacillus halotolerans - 1.0 x 10³ cells