Microbiome Standards
Validate your microbiome workflow
- Assess Bias in Microbiome Measurements
- Defined Composition
- Test the Detection Limit of Workflows
- Evaluate Microbiome Workflows
- Accurately Defined Composition
- Sensitive and Accurate
- Rigorously Test Workflows
Assess and Eliminate Bias
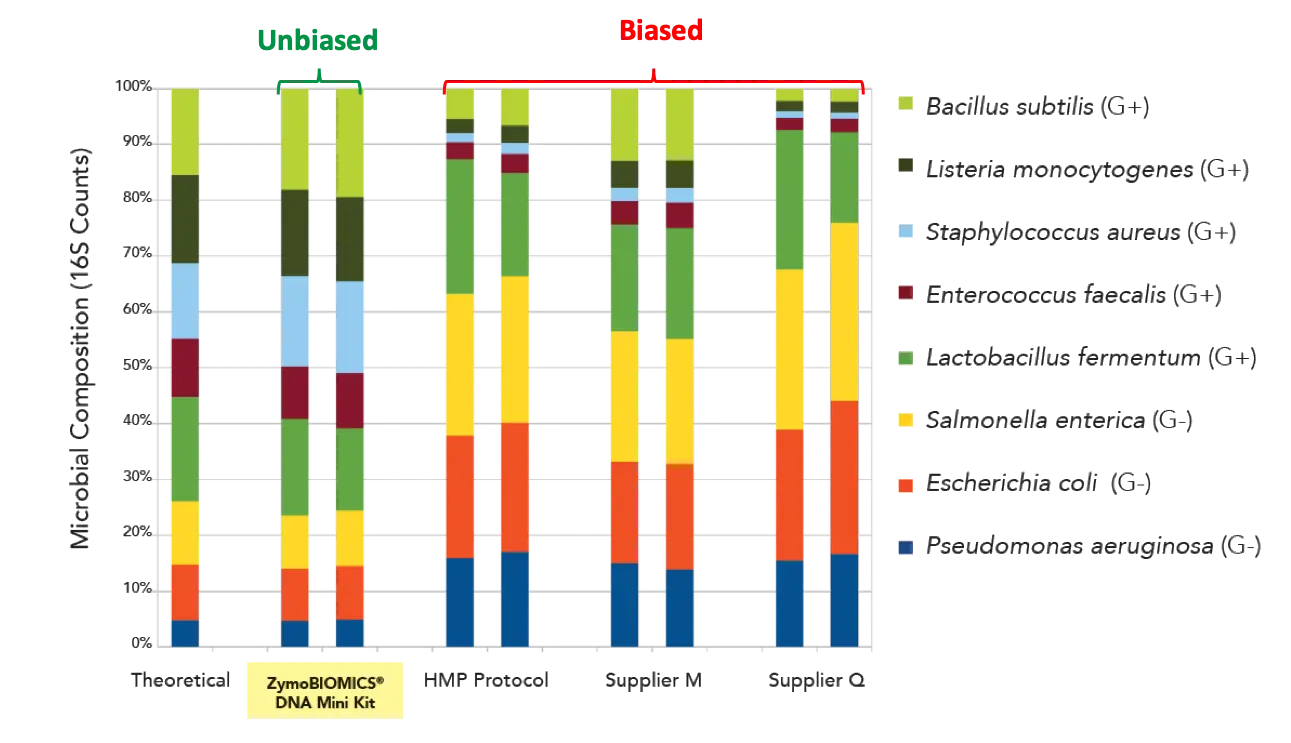
DNA from the ZymoBIOMICS Microbial Standard was extracted using four different methods: ZymoBIOMICS DNA Miniprep Kit (middle-left), HMP fecal DNA extraction protocol (middle), Supplier M (middle-right), and Supplier Q (right). Duplicates were performed. The extracted DNA was sequenced by targeted 16S rRNA gene sequencing. The theoretical/defined composition of the standard is shown on the left.
Defined. Quantified. Accurate.
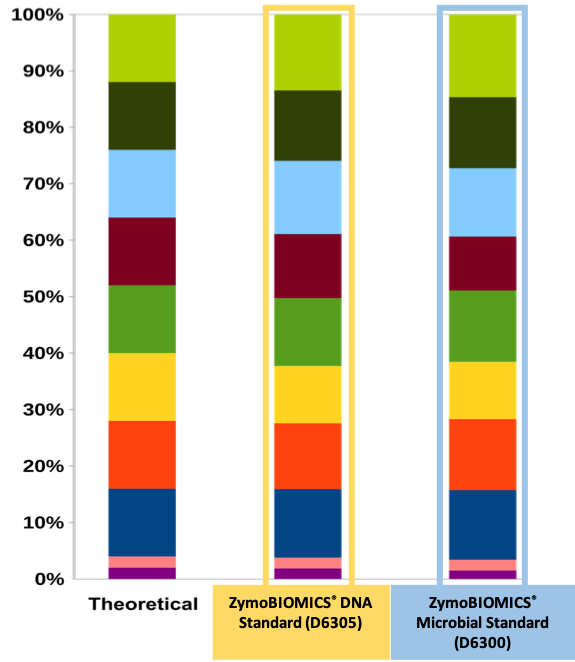
Microbial composition of ZymoBIOMICS standards determined by Shotgun Sequencing.
For the microbial standard (D6300), DNA was extracted using the ZymoBIOMICS DNA Miniprep
kit. The library preparation was performed using Kapa HyperPlus kit. Sequencing was
performed with Illumina HiSeq. Theoretical abundance (left) is given for comparison.
Ahead of the Competition
| ZymoBIOMICS Microbial Standards | Supplier A | |
|---|---|---|
| Abundance Variation | < 15% | < 1,000% |
| Foreign Contaminants | < 0.01% | < 10% |
| Include both Bacteria and Fungi | ❌ | |
| Strict Manufacturing QC | ❌ |
Test the Detection Limit of Workflows
Log-Distributed Abundance
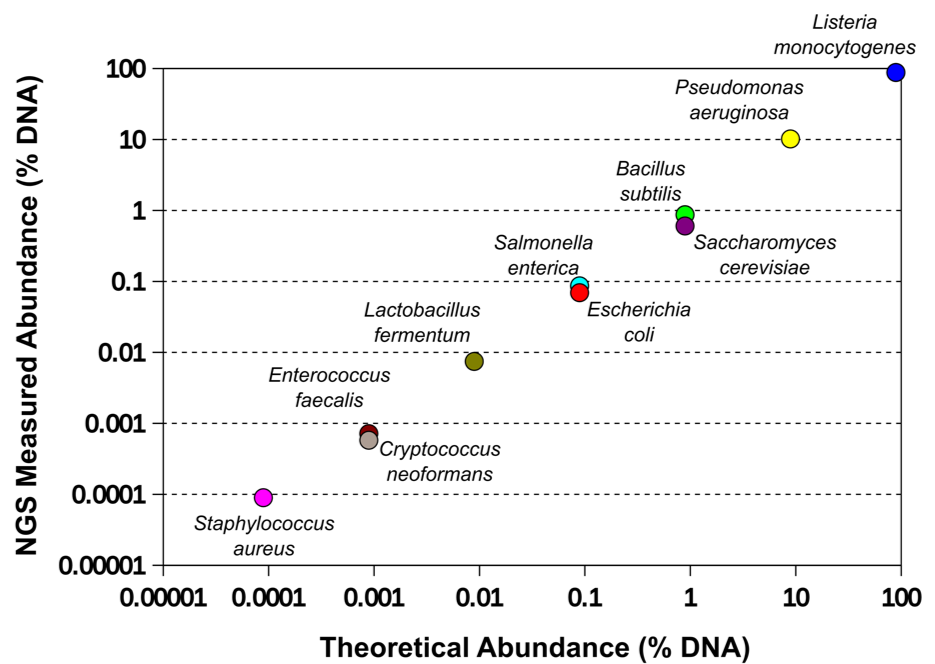
ZymoBIOMICS Microbial Community DNA Standard II (D6310) can assess both the detection limit and accuracy of your workflow over a broad-range (102-108 cells). This figure plots the composition of the standard as measured by NGS shotgun sequencing against the defined composition of the standard.
Test 16S Sequencing Workflows
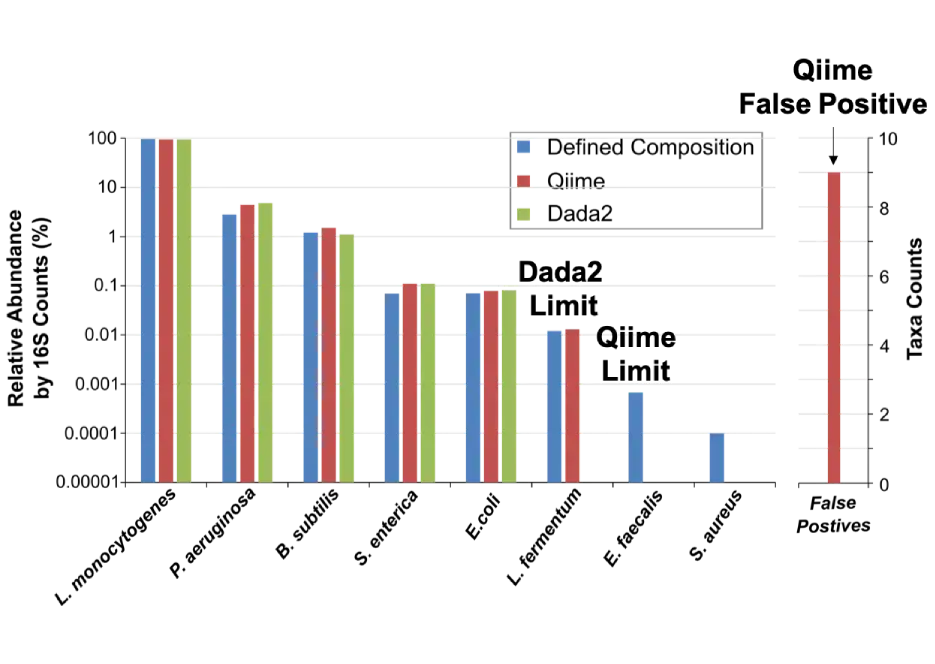
ZymoBIOMICS Microbial Community DNA Standard II (D6311) was processed through 16S rRNA gene targeted sequencing and the sequencing data was analyzed using two bioinformatics pipelines, QIIME (red) and Dada2 (green). The theoretical abundance (blue) is displayed to facilitate comparison. The performance can be assessed regarding accuracy, false positive rates, and detection limit.
Microbial and DNA formats

Microbial
(assess total workflow biases)
Extracted DNA
(Assess Library preparation biases)
DNA from the ZymoBIOMICS Microbial Standard was extracted using four different methods: ZymoBIOMICS DNA Miniprep Kit (middle-left), HMP fecal DNA extraction protocol (middle), Supplier M (middle-right), and Supplier Q (right). Duplicates were performed. The extracted DNA was sequenced by targeted 16S rRNA gene sequencing. The theoretical/defined composition of the standard is shown on the left.
Ensure Accurate Discoveries
| Product | Catalog # | Compo |
Format | Manual |
|---|---|---|---|---|
| Microbial Community Standard | D6300 | Even Distribution | Microbial |  |
| Microbial Community DNA Standard | D6305/6306 | Even Distribution | Isolated DNA | |
| Microbial Community Standard II | D6310 | Log Distribution | Microbial | |
| Microbial Community DNA Standard II | D6311 | Log Distribution | Isolated DNA | |
| Spike-in Control I (High Microbial Load) | D6320/D6320-10 | Even Distribution | Microbial | |
| Spike-in Control II (Low Microbial Load) | D6321/D6321-10 | Log Distribution | Microbial | |
| HMW DNA Standard | D6322 | Even Distribution | Isolated DNA | |
| Gut Microbiome Standard | D6331 | Staggered Abundance | Microbial | |